Prometheus
Introduction

Prometheus is an Open-Source systems monitoring and alerting toolkit that collects and stores it’s numerical measurements as time series data. Information is stored with the timestamp at which it was recorded, alongside optional key-value pairs called labels.
By the use of a multi-dimensional data model, data can be sliced and diced at will, along dimensions like instance, service, endpoint, and method.
It is based on a principal of Operational Simplicity, so that you can spin up a monitoring server where and when you want, even as a local server at home on your desktop computer. This without setting up a distributed storage backend or reconfiguring the world.
What is Prometheus?
It is a tool for Executive management, PO’s and clients to have a single view of project schedules, health, risks, progress and documents. Look at it from a financial aspect
Brief History
If we look back at how monitoring and alerting was in the “old-days”, we had small little light bulbs flashing and sounds that went off when something was wrong or and error happened, this was in the early days of monitoring and alerting. Back in that time there was only a handful of people that would know what, when and how to fix a problem that occurred. With the dawn of a more automatized and digital solution to the handle issues and know what is happening, it all got easier and you got a lot more information.
With software like Prometheus (and others), you now have detailed information about how a project is running, when something is failing, where it is failing. With this depth of information at hand one can quickly solve an issue, and you will have data logs on it as well. Welcome to the digital age of system monitoring and alerting.
Prometheus is an open-source project built at SoundCloud. Since it’s creation in 2012, there has been a lot of updates and improvement on the system. It’s now a standalone open-source project and maintained independently of any company. Prometheus joined the Cloud Native Computing Foundation in 2016 as the second hosted project, after Kubernetes.
Features
- A multi-dimensional data model
- PromQL, a flexible query language
- No reliance on distributed storage
- Pushing time series available via intermediary gateway
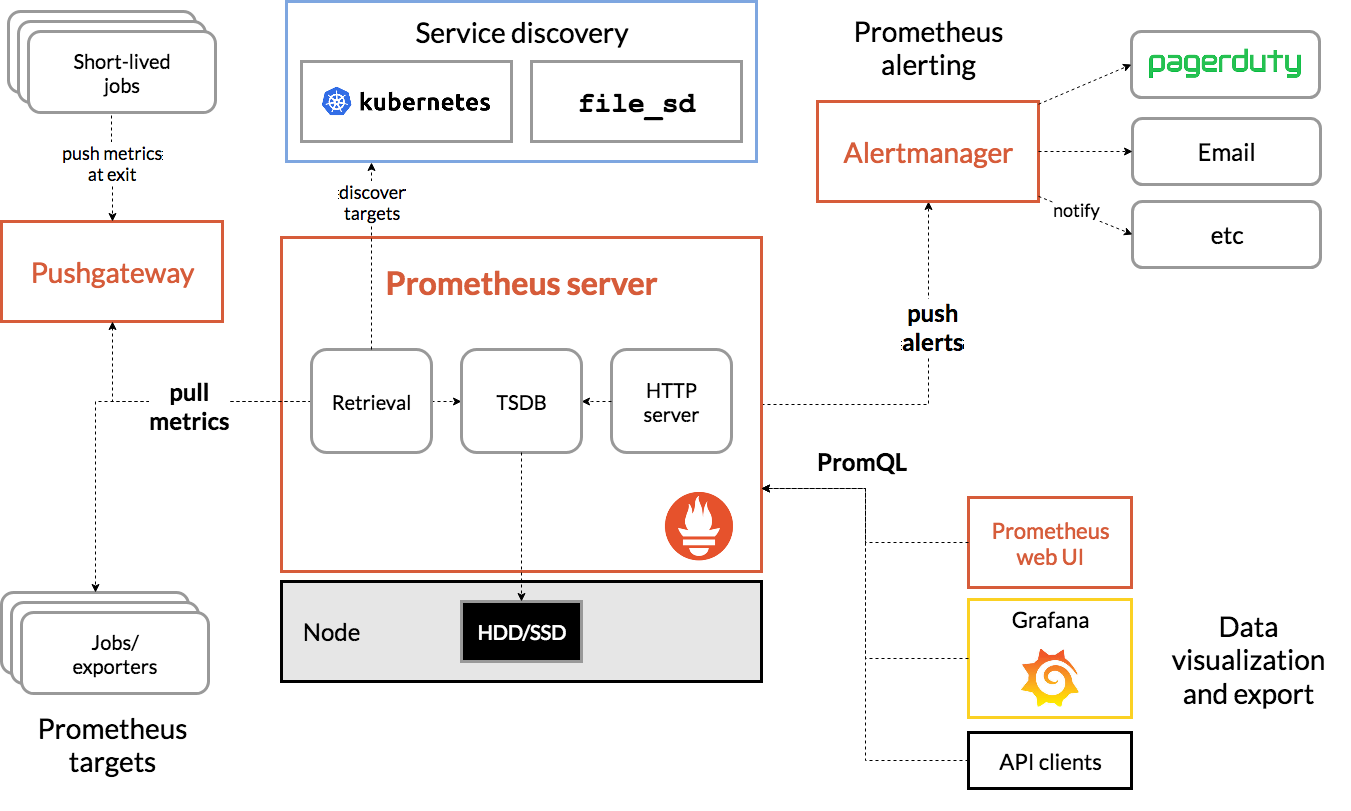
- Targets are discovered via service discovery or static configuration
- Multiple modes of graphing and dashboarding support

Strengths
With a richer data model you will also get a more detailed collection of metric. With Prometheus you get samples at arbitrary intervals as scrapes or rule evaluations occur, the new samples that is created are simply appended, this means that old data may be kept arbitrarily long.
example of how Prometheus stores samples from HTTP requests to API servers with a response code
api_server_http_requests_total{method="POST",handler="/tracks",status="500",instance="<sample1>"} -> 34api_server_http_requests_total{method="POST",handler="/tracks",status="500",instance="<sample2>"} -> 28api_server_http_requests_total{method="POST",handler="/tracks",status="500",instance="<sample3>"} -> 31The way Prometheus stores metrics is more detailed and you will have a better overview of the data that is collected. With the use of PromQL you will also have a great way for when visualization is needed, you can use Grafana dashboard, expression browser. Prometheus also comes with console templates to help you on the way to getting started with monitoring a project. Below is a list of some of the strength features that Prometheus has.
Some of the products strengths based on collection of quantifiable data would be the
- Storing of data metric
- Support of code queries
- Providing data source to any Grafana dashboard
- Ease of deployment
- The use of PromQL is really good for visualization purposes
Weaknesses
When it comes to using Prometheus for in depth event logging you are better with using InfluxDB. There is several other systems that you would have a better use of when it comes to more specified tasks and processes. ie.
- Sensus is better for collecting and processing hybrid observability data(this includes metrics and/or events)
- Graphite is better when you need/want a clustered solution that can hold historical data long term.
Prometheus could be a little more userfriendly with the UI then it is. But once you get the hang of it, it’s pretty easy. Learning PromQL can be tedious to do as well. This is Prometheus own query language that can be complex.
Comparison
Compared to InfluxDB, Prometheus is a better choice if you are primarily doing metrics, it also has a more powerful query language, alerting and notification functionality then InfluxDB has. Both of the systems has their strengths and weaknesses, where one is better then the other.
With Prometheus you get servers that are run independently of each other and only rely on their local storage for their core functionality: scraping, rule processing and alerting.
The commercial InfluxDB offering is, by design, a distributed storage cluster with storage and queries being handled by many nodes at once. With that, it means that the commercial version of InfluxDB will scale horizontally easier than Prometheus, but at the same time, you need to manage the higher complexity of distributed storage systems straight off from the start. Prometheus is easier to setup and run.
There is an open source version of InfluxDB that is similar to Prometheus, but not completely the same when it comes to the architecture of the system.
Both systems has a data model that has key-value pairs as labels, that is called tags. They both use support float64 data types but Prometheus offers this with limited support for strings and millisecond resolution timestamps, where InfluxDB offers has full support for it, along side of int64, and bool as well.
If you primarily doing event logging then InfluxDB is more suitable for this type of monitoring.
Summary
Prometheus is a great tool for systems monitoring and alerting, that allows you to really get into the depth of the amount of data that is collected for your projects. with tools like Prometheus you will get a much better overview of the health of your project, if and when something is failing this will be shown in logs and alerts. When thinking on the financial health of a project this lets you handle issues and problems at a much earlier stage then without using a toolkit like this. Projects are not bleeding money by having long periods of down time because a problem that is there needs to be located first.
And with the PromQL, short for Prometheus Querying Language, you can can query metrics within Prometheus. You can display expression’s return either as graphs or export it using the HTTP API
You will also find that it is a great tool for visualization when that is needed, you can use Grafana dashboard and expression browser more easy. Console templates is provide from Prometheus for you to use. When it comes to deployment it is quick to do when you need a new server for instance. And you have the PromQL query language.
You can read more at Prometheus own blog, here you will also find pictograms that shows the flow of use.
[!]A short intro video on Prometheus
Credits
- Robin Johnsen (ShaindalDev)
References
Pros and Cons review https://www.trustradius.com/products/prometheus/reviews?qs=pros-and-cons#overview
Wikipedia on Prometheus https://en.wikipedia.org/wiki/Prometheus_(software)
Prometheus own site https://prometheus.io/docs/introduction/overview/
Prometheus blog https://prometheus.io/blog/
Intro video of Prometheus https://www.youtube.com/embed/ioa0eISf1Q0
Prometheus youtube channel https://www.youtube.com/@PrometheusIo